BTC/USD 滑向 59067,跌勢對齊維持
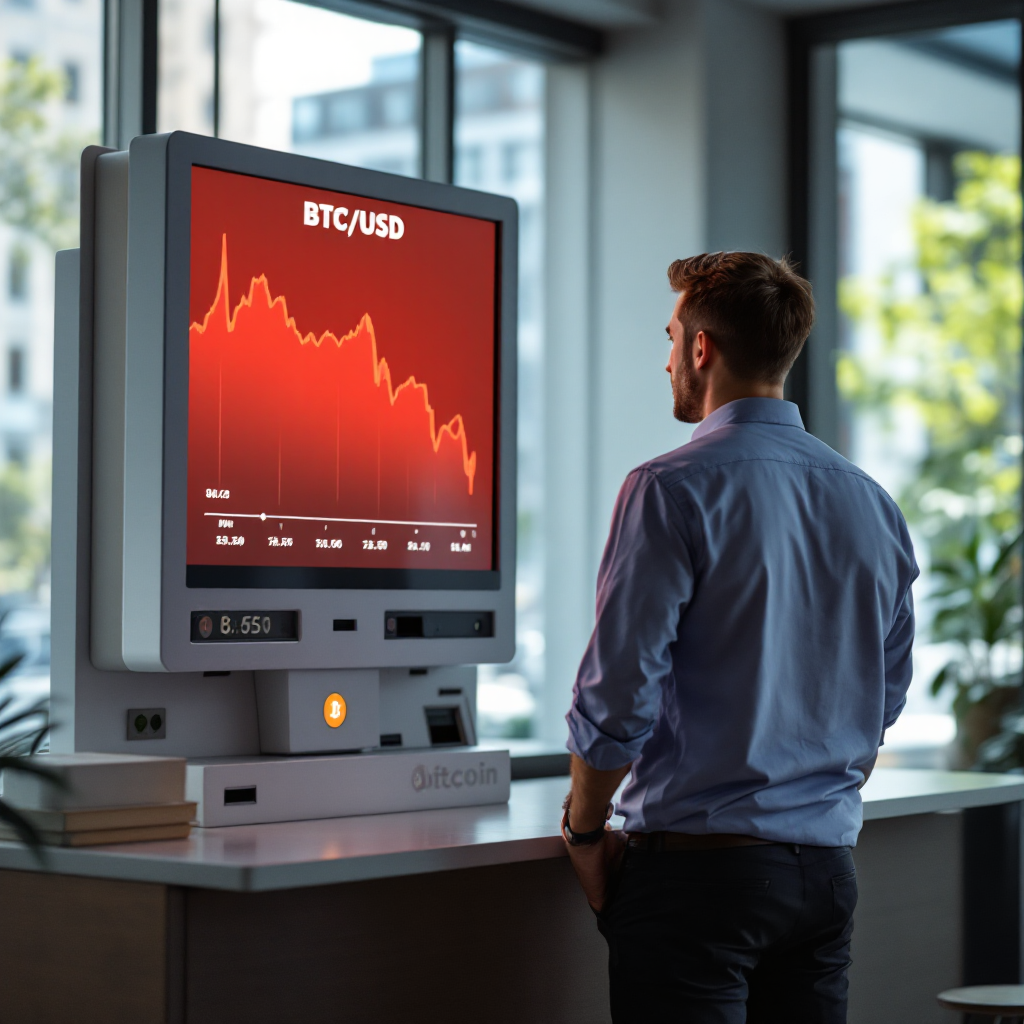
Bitcoin trades near 59757 with trend aligned down across all timeframes and multiple support levels broken over the past week; we sell rallies into the EMA20 cap while 59067 remains the next structural pivot.

Trading analyst covering macro, equities, and digital assets. Focused on systematic risk frameworks and disciplined entries.

核心要点
- No macro catalyst to arrest the slide; pure trend momentum is driving the move lower.
- BTC/USD is down nearly 6% on the week with every bounce sold and supports broken.
- EMA20 at 61537 caps rallies; a daily close below 59067 opens the next leg lower.
比特幣持續下滑,所有時間框架指向同一方向,賣方無一例外地捍衛每次反彈試圖。
該交易對在過去一週內下跌近 6%,交易於緊密的 59670 至 60180 日內範圍內,日盤進一步增加了增量虧損,疊加持續更廣泛的弱勢。目前沒有宏觀催化劑可以解釋反轉;這是清晰的趨勢壓力,沒有明顯的反向流。
設置對跟隨趨勢的交易台來說是明確無誤的。價格遠低於 EMA20 61537.11 和 EMA50 62721.37,兩條均線現在充當阻力而非支撐,EMA200 66710.22 結構上遙遠且近期無關。趨勢在 1H、4H 和日線時間框架上對齐向下 — 最清晰的動能讀數。RSI 正漂向超賣區域,但尚未觸發持續反彈買盤,波動性極端。在下跌市場中,高波動性會放大動能而非製造均值回歸機會。過去一週內先前的支撐一次次被突破,確認買方在任何近期報價處缺乏信心,賣方牢牢控制局勢。
我們傾向做空,並在 60180 至 61537 區域內賣出反彈,該區域是日內高點和 EMA20 匯聚的天然阻力。下一個結構性底部是 59067.45;日線收盤跌破該水平加速看空情景並消除任何近期反彈論點。
本內容僅供參考,不構成投資建議、推薦或買賣任何金融產品的要約。交易存在重大風險。過往表現不代表未來結果。
This content is for informational purposes only and does not constitute investment advice, a recommendation, or a solicitation to buy or sell any financial instrument. Trading carries significant risk. Past performance is not indicative of future results.
相关文章
- BTCUSD
 SELL · BTCUSD
BTC/USD 滑向 59067,4小時/日線下降趨勢重新確立
Bitcoin is grinding lower under all three key EMAs with the 4H and daily trend both pointing down; rallies into 59576 EMA20 are sells while 59067 support is the immediate line in the sand.
- BTCUSD
 SELL · BTCUSD
BTC/USD 跌破 60272,一致性下跌趨勢保持賣方主導
Bitcoin trades heavy below the EMA20 at 60272 with trend aligned down across all timeframes and prior support levels continuing to break; we sell rallies while 60524 caps.
- BTCUSD
 SELL · BTCUSD
BTC/USD下滑至59067,跌勢在各時間框架內持穩
Bitcoin trades near 59882 with trend aligned down across all timeframes and multiple support levels broken over the past week; we sell rallies toward EMA20 at 61391 while 61926 caps.